
It’s strange. I always thought that New Zealand has a pretty progressive tax system – that the richer people get taxed more than the poorer, and that we have a share the spoils system that helps make NZ a great egalitarian society..
Meanwhile the USA is meant to be a dog eat dog place run by rabid Republicans that only care about reducing the tax burden for the incredibly wealthy at the expense of the downtrodden poor.
But no.
At least relatively. It is actually far far better (taxwise) to be poor in the USA, UK or Australia. Conversely, and somewhat unbelievably , it is far better to have a high income in NZ than those countries.
I’ve done some rough numbers – comparing NZ’s tax on “taxable income” with Australia (Federal plus NSW state), USA (Federal plus New York State and City) and UK (Blessedly simple). There are a bunch of caveats, so many that I’ve put Ten Caveats at the bottom of the post, after the fold.
Here is the basic result, where you can see how much tax you would pay if you earned a certain amount of US Dollars, and lived in the four different areas:

The shape of the curves is interesting – New Zealand starts very high, while the other countries give the poorer folk a break.
At USD $15,000 (NZ $21,500) low income Kiwis are getting a raw deal versus the rest. These charts show how much someone earning a certain level pays in total tax:

Everything is about even at $20,000 and $50,000 (see bottom of post), but at USD $100,000 (NZD $143,000) Australia is the place that is looking pretty sour. “Everyone” seems to say that tax is cheaper “over there” – but this is manifestly untrue for NSW professionals.

At USD $200,000 you would actually pay least tax if you lived in New York – which incidentally is one of (if not the) most expensive State/City tax combos in the USA. Australia is definitely not the place to be, with Aussies paying a crazy 9% more than taxpayers in USA & NZ, and 8% more than those in the UK. (That 9% is worth $18,000). Ouch.

There are a bunch more charts after the fold:
Here’s the USD $400,000 chart, which must make well paid Aussies feel a little ill. Those USD $400,000 income Aussies are paying about USD $47,000 MORE in tax than their NZ counterparts. Double ouch.

Let’s look at the really high income folk. You can see the Australia line just goes high and stays high, while the NZ line is underneath all three other jurisdictions from USD $206,000. I’m not saying where I am on the curve (I’d have to ask my mother…) , but moving to Australia permanently does not appeal on a tax basis.
Here is some other data (Orange charts), pulled from an excellent, if short, Australian Government briefing paper. It is a bit dated, and again there are plently of caeveats about the data not really being comparible, but gee, look at the charts. These are in Australian dollar (2o05) terms:

New Zealand taxes the poor much more heavily than the rest for the lower income groups, then eases off for the higher income folk:


So there you have it. NZ has a relatively regressive tax system, taxing the poor more than the USA does, and letting the higher income people pay less tax. Of course we have a social welfare system that tops up those lower incomes, and all sort of other things are going on, so let’s look at the caveats:
Ten Caveats
1: The tax rates are on “taxable income”, which can be very different across jurisdictions. In some places you are able to claim a ridiculous amount of exemptions and so forth, while in others there is little to do. Mortgages are a big example here.
2: It assumes that people declare their tax, and don’t use a foreign tax haven or dodgy tax avoidance/evason system. (I don’t have tme for these as judgment day will always come)
3: The NSW rates are higher than QLD, Vic and WA. I picked NSW as Sydney is a favored destination for Kiwis.
4: Similarly as mentioned NYC is not the cheapest tax rate in the USA – indeed there are zero taxes in Texas. However, given that New York City is a far more fun place for Kiwis than Dallas, I plumbed for Manhattan.
5: This assumes that you are paying for the same services, which is patently not true. In the US, for example, you have to pay (well you should pay) for health insurance in order to get at least a basic level of care. YOu can also get sued of you crash into someone, while in NZ injured parties are covered by ACC. Meanwhile in New Zealand you won’t have the same level of infrastructure or propensity to fight wars than the US.
6: This only looks at income tax, not at sales (GST) taxes, rates and duties. In NZ, for example, you’ll pay virtually no duties (aside from GST) on almost all goods, and ther eare very few artificial trade barriers. This means that motor vehicles are far cheaper in NZ than in Australia.
7: Cost of living varies wildly between different places, so actual disposable income will vary more.
8: I have not taken any superannuation into account – either it was embedded in the tax rate or not. I did include NZ’s ACC 1.3% allowance, and Australia’s health care premium.
9: You generally get paid more in the USA, UK and Australia (in that order) than in NZ. Who cares about a lousy 9% extra tax if you are earning double what you were paid downunder?
10: I did not take into account any social welfare payments made to, say, lower income groups. This could have a dramatic effect on those lower effective tax rates especially.
11: (bonus) I’m assuming I didn’t make any rookie mistakes in the calculations.
To do this properly needs a thesis. Perhaps there is one out there.
And to close, for completeness, here are some more charts:
At US $20,000 things are pretty equal, as they are at $50,000.


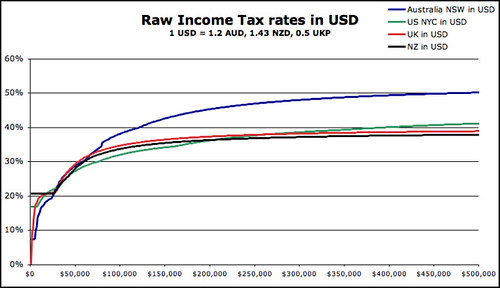
Finally the raw tax rates in local currency:


You are truly amazing Lance! Well done
LikeLike
Yes, truly amazing. Amazingly shallow analysis, showing an ability with a graphing tool.
No inclusion of ACC levies, health insurance (or taxes), transport levies, education, fuel taxes, GST, etc.
Here’s what you do.
1) Define a set of government services – this is your basket of goods.
2) Price them in each jurisdiction.
3) Add up the price for each income bracket.
Essentially, the BigMac index for government services.
Now prepare your graphs.
Anything else is comparing apples to oranges.
LikeLike
Oh, and don’t forget to list the percentage of the population in each tax bracket, and the average income.
LikeLike
HBSB
It is easy to throw stones – perhaps you didn’t read to the end? The bit about this taking a thesis to do this properly? Of course this is simple – I only had an hour or two.
ACC levies are in there, as explained. In the caveats, if you read them?
Health Insurance is in there for Australia, you don’t have to pay it in the USA or the UK. (I didn’t in either, though my employers did)
Education is generally included in the tax basket. Actually in the US it is paid for out of rates (not included), in other places by other taxes. As a single taxayer (that’s the example I used) I am not unduly concerned about education costs. Yet.
GST, like rates, is not an income tax, and don’t get me started on the convoluted state by state sales taxes in the USA. The thing is, with consumption taxes you only pay if you spend, and so they are also regressive.
Fuel taxes are another exception. Actually I’d rather be paying higher fuel (and smoking & drinking) taxes than lower. There’s a nice public good element to these, whereby it reduces out overall tax burden to make access to these things exensive.
Overall if you want to construct a basket then you’ll pretty rapidly run into trouble. What is education? The quality of the high schools in the USA is woeful comared to NZ. The universities also suck. Unless you go to Groton. Or Yale. Which one do you pick? If you are poor then Yale will help you financially – should you factor that in?
How do I account for the fresher tastier food in NZ than in the USA? How do I account for restaurants being from trivially cheap to wildly expensive in NYC? How do I account for the differences in actual fuel consumption in the US (big, ugly cars) to NZ (small eficient ones?). For that matter – what constitutes an average car is quite different in Europe and NZ from Australia and USA.
How do I account for efficiency in tax collection services? ability to start a business in 1 hour in NZ versus days or weeks in other places?
What about savings ratios? capital gains tax? access to capital markets? average rents (rent controlled or not?) average house prices? average amount of food consumed? Average income?
The list goes on.
It’s not so easy, But you do have to start somewhere.
LikeLike
This is the analysis you would expect in a country with such a flat tax system. The only person in the media I would expect to do this would be Rod Oram (now that you have flown the nest). Everyone else seems determined to demonstrate what an unhealthily overtaxed and state encumbered society we live in.
For all the wailing and gnashing of teeth about being over taxed 39% is not a high top tax rate and the difference between highest and lowest rates is quite small.
Maybe some comment on the reasons why progressive taxation is considered “fairer” by many economists would also be in order.
LikeLike
It is easy to throw stones. Amazingly, that doesn’t make the analysis any deeper, or more useful.
I’m not complaining about your findings, just the methods used to reach them. It is bad statistics. I would put it in the same barrel as someone performing a study on teen sexuality rates by talking to girls at a planned parenthood clinic.
Basically, your graphs show the same problems that every single news organisation has when they start to compare unemployment rates between countries. You can’t do it – they measure different things! For example, the US measures it as a percentage of population, while Canada measures it as a percentage of the workforce. It’s always funny to watch journalists complain that Canada’s unemployment rate is usually twice the American one.
So, until you get a common frame of reference, comparisons like those made in this post are, at best, misleading.
LikeLike
HBSB: you are welcome to do your own analysis.
For me this works, as I have a pretty good idea of my earning power, the major costs and the various government services in each jurisdiction.
Indeed I do not really use much Government provided services, aside from basic infrastructure, which all 4 places have adequately provided.
So for me, the frame of reference is fine. YMMV.
LikeLike
HBSB, you are the one being misleading. For example, when you complain about unemployment stats you overlook this rather glaring sentence from the Stats NZ press release:
“New Zealand now has the lowest unemployment rate within the group of OECD countries that have standardised unemployment rates.”
Conversely “employment is at the highest level recorded by the HLFS and the unemployment rate is the second lowest rate recorded.”
http://www.scoop.co.nz/stories/BU0508/S00201.htm
So Lance is, in fact, comparing apples with apples.
What’s your next point?
LikeLike
Lance,
Given your knowledge of the additional costs and earning ability in each jurisdiction, then yes, the graphs have local use for you.
I do have to disagree with this:
Indeed I do not really use much Government provided services, aside from basic infrastructure, which all 4 places have adequately provided.
That you don’t use it doesn’t mean you aren’t paying for it. ;)
I do tend to overreact to bad math. It’s a trigger for me, and I’m working on it.
Don,
Everyone seems to think I’m arguing that NZ is overly taxed. I’m not. this isn’t about that. It’s about the way the data is presented. It is comparing individual tax rates between NZ and the US and coming up with a graph. Since (I understand) that transfers to individuals make up substantial portions of government spending, in order to make sure that the comparisons are valid, the services offered must be made comparable. Otherwise, the data will favour the countries that do not offer the service – such as universal health care in the US. At the very least, I would include the cost to the employer of an HMO (bounded spending) health care plan, and pension benefit as part of the tax rate.
My use of unemployment rates was to merely point out the problem with comparing percentages without taking their meaning into account. It wasn’t meant as an argument that NZ sucks, or that it is tanking, or anything like that at all. Hence my additional comparison to the sexuality study.
My complaint is about presentation, not about the results. I’m very interested in seeing more researched results.
This sort of information is interesting:
http://icsc.un.org/col-rpi.asp
http://www.finfacts.com/costofliving.htm
Since that would seem to indicate the relative costs of a common basket of services (but not taxation).
LikeLike
Hi all,
This analysis is simply incorrect – no offence to publisher. Please read the following for a more informed and well research viewpoint: http://www.nzbr.org.nz/documents/publications/publications-2005/120405tax.pdf
It takes a comprehensive look at NZ’s progressive tax policy and draws some very interesting, if unsurprising conclusions. New Zealands progressive tax system is an absolute exploitation of the minority – but not the minority you might think. It shows that the top 3% of Kiwi’s pay over 25% of the personal income tax. It also questions the fairness of a tax system where the top 3% paying 10 times their share – while anyone earning less than $60,000 doesn’t pay enough tax to cover the cost of the Government services they consume (that is a whopping 90% of the population). It is a very good report so I won’t spoil the rest of it.
LikeLike